


Welcome to a world where managing content and data has become a breeze, thanks to Flotiq.
As an API-first Content Management System (CMS), Flotiq empowers you with the ability to create and manage your content using any technology, framework, or language.
Today, we're delving into a unique use case of our product - using Flotiq in conjunction with Excel (or Google Sheets) to collect survey data and analyze it for compelling visualizations.
Stay with us to learn:
- How to create a survey form using Flotiq's form creator.
- The process of distributing your survey to respondents and collecting their responses.
- How to seamlessly export survey data from Flotiq to Excel via API.
- Techniques for analyzing survey data in Excel and creating compelling visualizations.
- The process of interpreting analyzed data to gain valuable insights.
- How to use these insights to refine strategies, improve your products or services, and optimize business processes.
- The advantages of using Flotiq and Excel together for efficient and accurate survey data analysis and visualization.
- How Flotiq solves the common challenges of data extraction and export for analysis in data visualization tools.
Challenges with exporting survey data for analysis
Have you ever felt bogged down by the sheer effort needed to export survey data from a traditional CMS to a data analysis tool like Excel?
Manual data transfer is tedious, prone to errors, and can consume a significant amount of your valuable time.
This is a universal struggle when using a CMS for data visualization in Excel purposes, but thankfully, we have a solution that will transform your data management process.
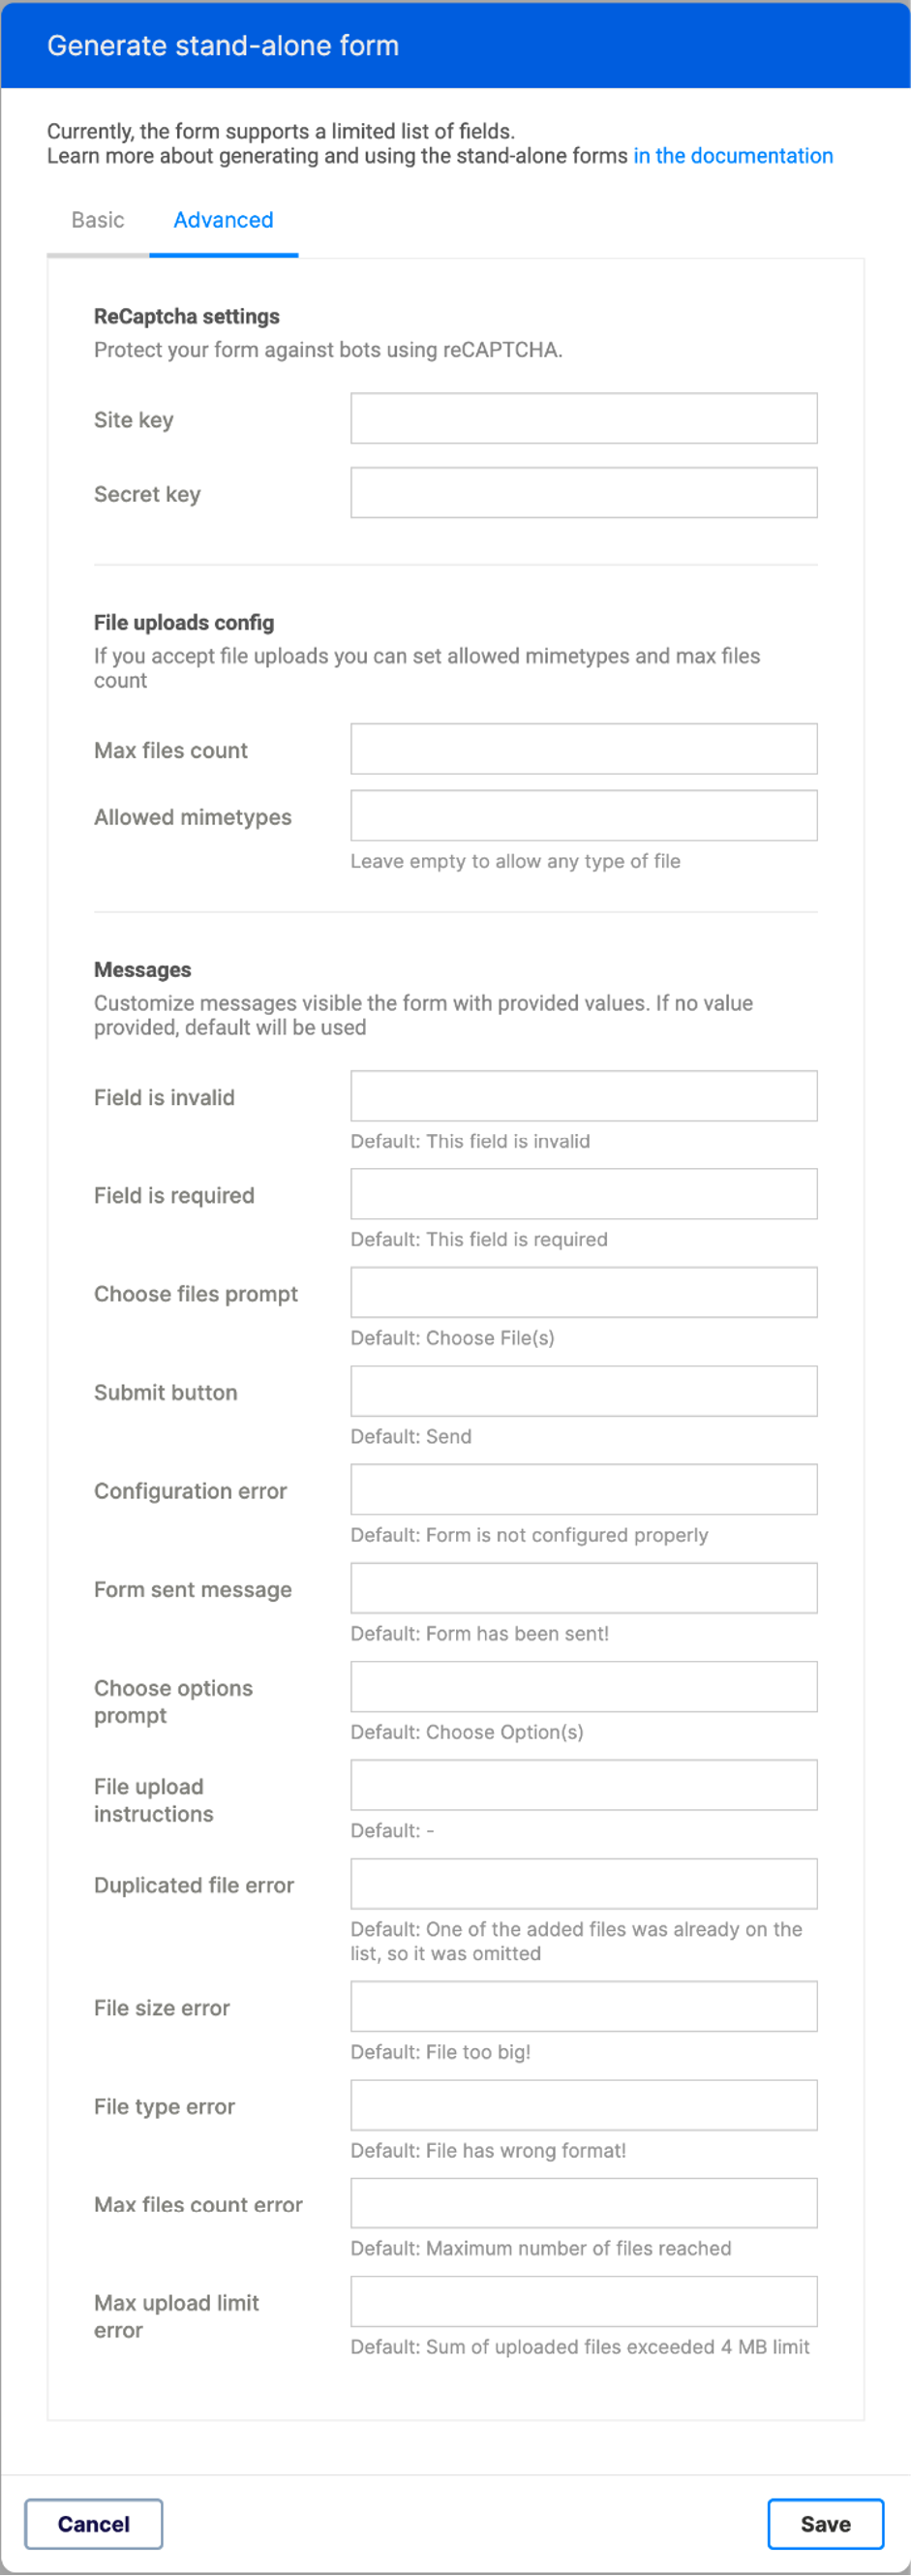
Building and distributing surveys
That’s where Flotiq comes in, a CMS that not only helps you create and distribute surveys effortlessly, but also makes the data extraction process as seamless as possible.
Let's get into the details of how you can create a survey with Flotiq:
- Access the Flotiq panel and navigate to the
- Use our intuitive interface to design a custom survey with various types of questions, including multiple-choice, rating scales, and text fields.
- Configure the survey title, description, and any necessary instructions before hitting the 'Save' button.
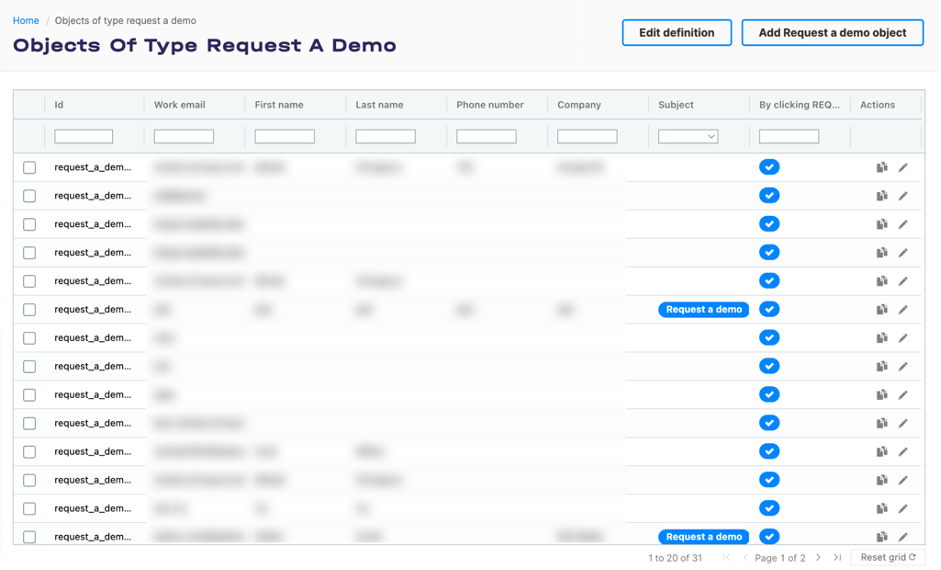
Once your form is ready, you can embed it on your website. As responses roll in, Flotiq automatically captures and stores the data securely in the CMS, prepping it for analysis.
The power of integration: exporting data from Flotiq to Excel
This is where the magic happens. Thanks to Flotiq’s API-first design, exporting your collected survey data to Excel, one of the leading data visualization tools, becomes a simple, seamless process:
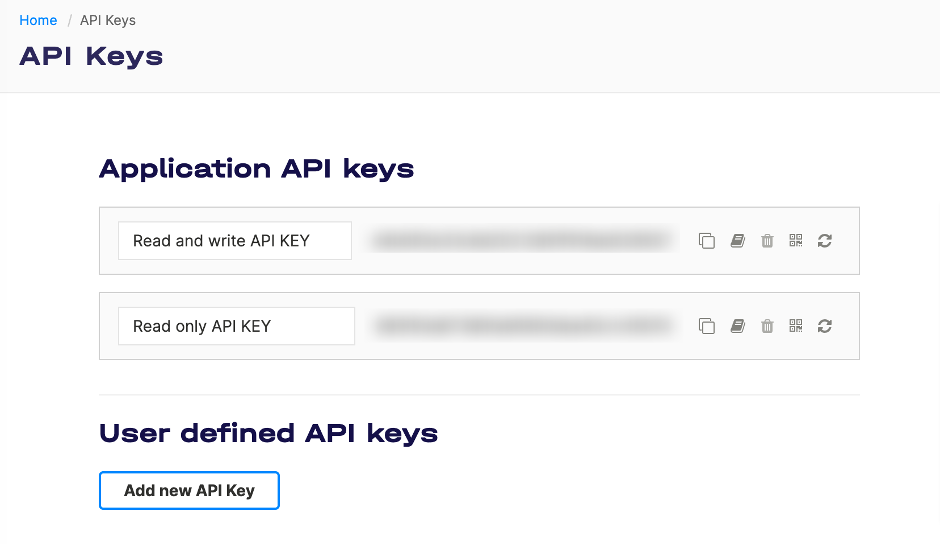
- Obtain your READ KEY from Flotiq, which grants access to your survey data.
- Open Excel, navigate to the "Data" tab, and select "From Web".
- Enter the REST API URL provided by Flotiq, along with the necessary headers, and use your READ KEY as the authentication header.
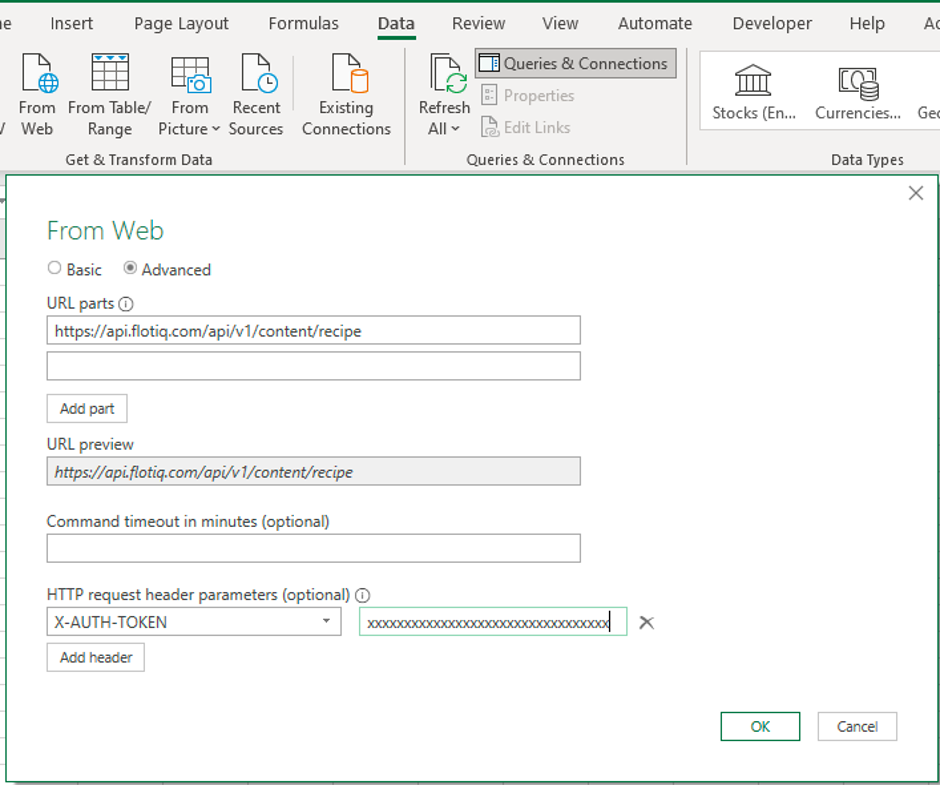
- Configure the import settings as per your needs, and voilà - your data is ready for analysis!
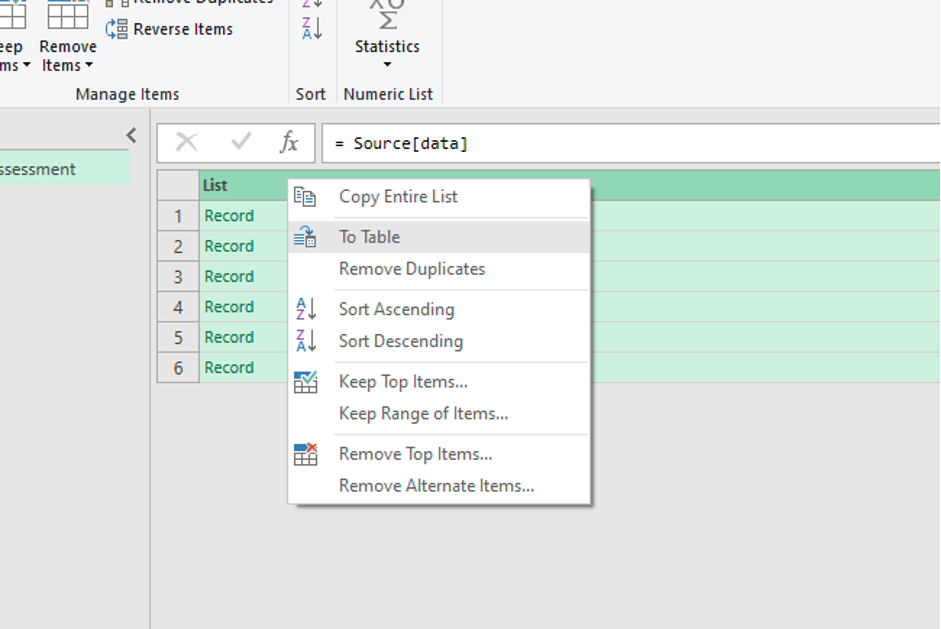
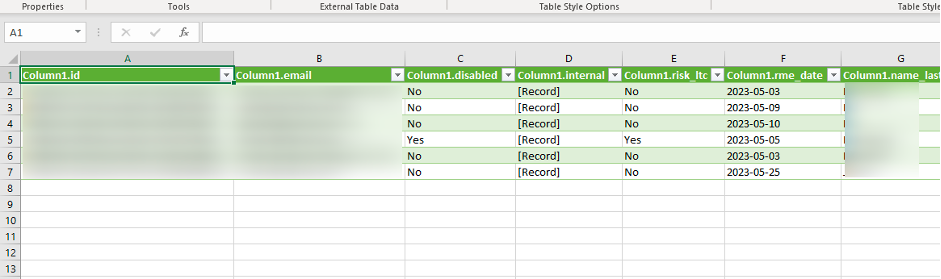
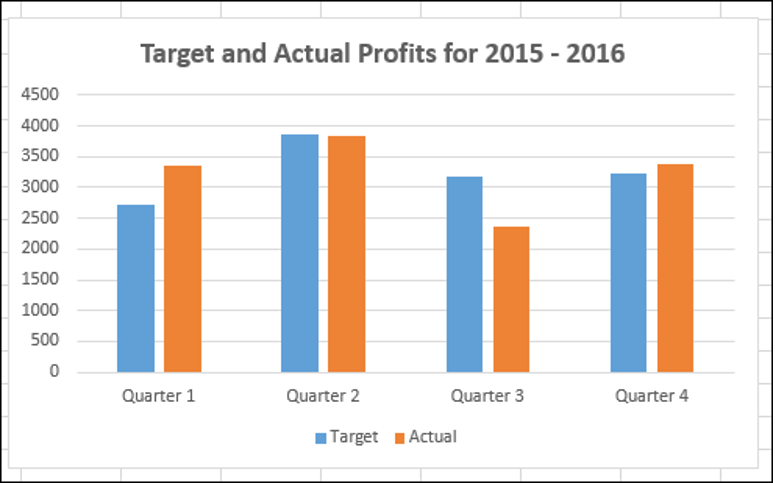
Analyzing survey data in Excel
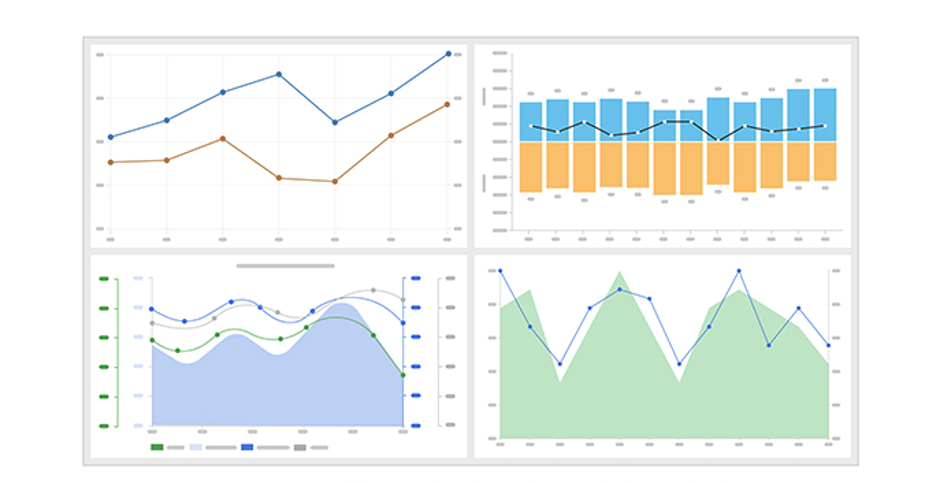
With your survey data now in Excel, it's time to visualize the data with the powerful features that this tool offers. Whether you're creating graph visualization, charts, or even an Excel map chart, the process is now at your fingertips:
- Review the imported data, ensuring each column represents a survey question or relevant information.
- Utilize Excel's sorting, filtering, and pivot table generation features to analyze the data.
- Create compelling visualizations with Excel features, providing you with data visualization examples that can speak volumes.

Drawing conclusions and making informed decisions
Once your data visualization in Excel is complete, it's time to interpret your findings.
Look for patterns, trends, and correlations in the visualizations to gain meaningful insights. These insights can guide you in refining your strategies, improving your products or services, and optimizing business processes based on your respondents' feedback.
Be sure to search for some data visualization examples to get a reference point in your analysis.
Benefits of using Flotiq and Excel for survey data analysis
Using Flotiq and Excel for your survey data analysis not only makes data extraction a breeze, but also enhances your data visualization capabilities.
By integrating these tools, you get a streamlined, efficient, and accurate workflow for data collection and visualization. The tedious process of manual data transfer becomes a thing of the past, and you can spend more time gleaning insights from your data.
Conclusion
The combination of Flotiq and Excel for analyzing survey data is a game-changer. By addressing the universal struggle of data extraction and providing an efficient CMS for data visualization, we've bridged the gap between data collection and analysis.
So why wait? Start leveraging the power of Flotiq and Excel today for your survey needs, and explore the power of data visualization like never before.
Join today for your first FREE plan that unlocks the power of Content Creation & Management for you!